

It’s basically stating wholesalers are “rationing” rice. Tyson, who markets some of my favorite chicken breast meals, is expected to spend on or about $1 billion in chicken feed by within a year. What’s that mean for us? We’re going to be paying higher prices on the chicken breasts we enjoy so much!
By Tuesday evening, Drudge had this developing headline: “NOW -- A FERTILIZER SHORTAGE...” Fertilizer prices are obviously going to go up. Who buys fertilizer? The produce growers so that means our produce prices are going to go up!
Higher prices = increased expenditures in food items not only at supermarkets but soon at restaurants from fast food to dine in.
Americans already had enough paying high prices for gas at the pump. How will they tolerate the increased prices in food? They can’t blame the oil companies for it. So who’s to blame?
Environmental liberals (here on known as enviro-wackos), that’s who!
How so?
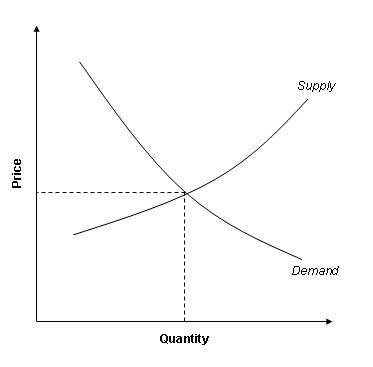
It’s a simple matter of understanding the law of supply and demand which is illustrated by this graph:
Our case study is the increased demand in Bio Fuels. Yes, this is Economics 101. Try to keep up, ok?
Enviro-wackos have convinced the nation that we are too dependent on foreign oil. (That’s what the Iraq War is all about, right?) So what’s the alternative to stop trading innocent blood for oil? Bio Fuels! It’s good for the environment. It’s widely available. So what’s the harm? How about increased demand for corn crops? They have to cut into a supply of something. And cut into a supply of something it did: tortillas! Your burritos, rolled up tacos, hand-made tortillas are all costing more and will get worse.Let’s look at these next two graphs. It shows the effects of an increase in demand and supply respectively.
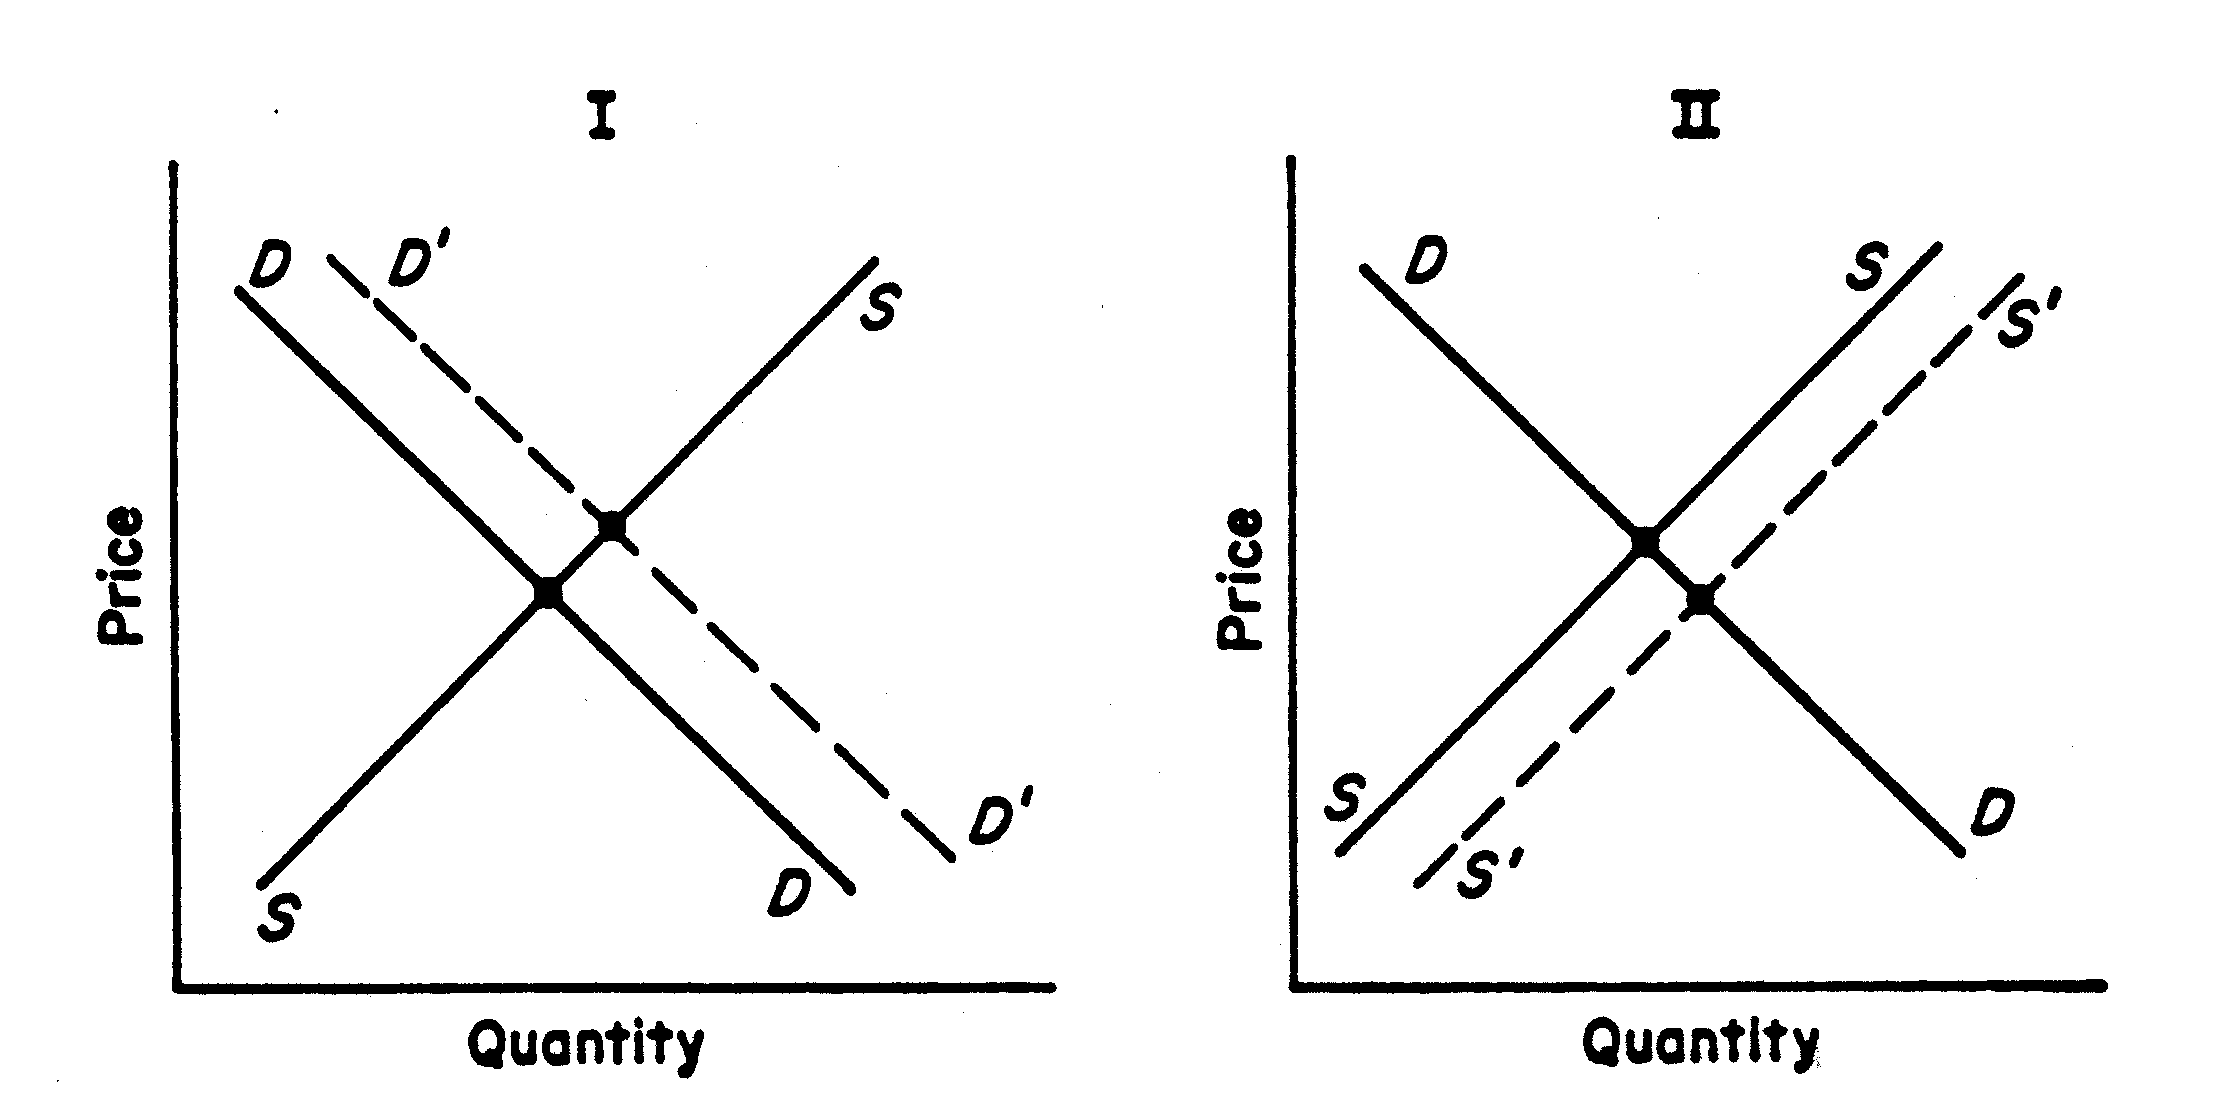 Graph I shows demand (solid line “D”) increasing (dashed line “D’”). The point where demand crosses the supply line (solid line “S”) is the price (dots/points on intersecting lines). The y-axis (price/the line going up) represents an increase in price. In other words, our dot on Graph I shows the price going up. The higher the dot is on the graph, the higher the price is as indicated by the y-axis. This is true assuming that there is no change in supply. That means no increased quantities of that item are being created or for some other reason lost.
Graph II shows supply (solid line “S”) increasing (dashed line to the right “S’”). Let me point out that any line moving – demand or supply – anyway from the point of origin (the point where price and quantity are at “0”) indicates an increase. So, if demand for a item remains the same but supply increases through, say, more efficient means of producing without an increase in cost to the supplier, then there’s more for the buyer to get from the, in this case, market. This means the item is going to be cheaper.
Thanks to the sudden increase in demand in bio fuels, there is not enough time to crank out the supply the public clamors for right now. So supply isn’t moving but demand is. This last graph illustrates what I mean:
 So thanks to the enviro-wackos forcing their belief system on everyone else without thinking about the outcome, we’re having to pay more for the same foods we could’ve bought by the dozen last month.
I didn’t set out to tell you what the solution to this problem is. I’m only informing of where blame could and should be directed at: the bleeding heart liberals who mean well but have no idea how to implement their foolhardy, good-intended ideas.
I’ll save the rest for a later entry. For now, enjoy that nearing-$10 Twice Grilled burrito from El Pollo Loco!
No comments:
Post a Comment